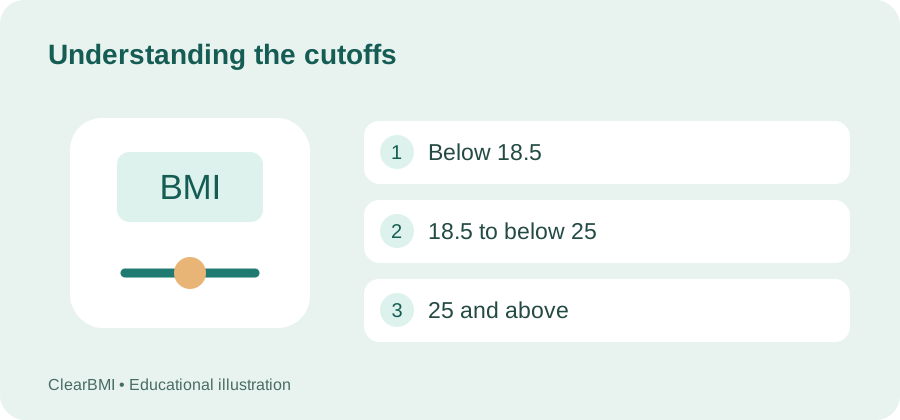
Once you have a BMI number, the next question is usually "so is that... fine?" The standard adult categories give a quick answer, but the boundaries and their meaning deserve a bit more context than a single label provides.
The four standard adult categories
| BMI | Category |
|---|---|
| Below 18.5 | Underweight |
| 18.5 – 24.9 | Healthy weight |
| 25 – 29.9 | Overweight |
| 30 and above | Obese |
These thresholds come from World Health Organization guidelines, based on population studies linking BMI ranges to average health outcomes. You can check where you fall using our free BMI calculator.
Underweight (below 18.5)
This range is associated, on average, with increased risk of nutrient deficiencies, weakened immune response, and in some cases an underlying condition affecting appetite or absorption. It's not automatically a problem for everyone — some people are naturally lean with no health concerns — but a BMI consistently below 18.5, especially with unintentional weight loss, is worth discussing with a doctor.
Healthy weight (18.5–24.9)
This range is associated with the lowest average health risk across large population studies, which is why it's labeled "healthy." It's a wide range, though — someone at the very bottom and someone at the very top of this range can look and feel quite different, and both are within the same broad category.
Overweight (25–29.9)
This range is associated with a moderate increase in average risk for certain conditions, including type 2 diabetes and cardiovascular issues, though the relationship is far from deterministic — plenty of people in this range have excellent metabolic health, particularly if they're physically active. Context (see below) matters a lot here.
Obese (30 and above)
This is often further divided into Class I (30–34.9), Class II (35–39.9), and Class III (40+), since health risk tends to increase further within this range. As with the overweight category, individual health varies significantly — but on average, this range is associated with meaningfully higher risk for several chronic conditions, which is why it's typically the category doctors focus on first for follow-up conversations.
Important context these categories don't capture
- Muscle mass: a muscular person can land in "overweight" or even "obese" while carrying very little body fat. See BMI for athletes.
- Fat distribution: two people with identical BMI can have very different health risk depending on whether fat is concentrated around the abdomen. See waist-to-hip ratio vs BMI.
- Age: body composition shifts naturally with age even at a stable BMI. See how BMI changes with age.
- Ethnicity: some research suggests certain populations face elevated health risk at somewhat lower BMI thresholds than the standard ranges reflect, which is an active area of public health discussion.
The practical takeaway
Use your category as a conversation starter, not a conclusion. If your result falls outside the healthy weight range, that's a reasonable prompt to check in with a healthcare provider — not because a single number tells the whole story, but because it's a fast, free flag worth paying attention to.
This article is educational and general in nature, not personalized medical advice.
What happens near a category boundary?
At 1.70 m, a weight of 72 kg gives a BMI of about 24.9; 73 kg gives about 25.3. Those results sit on opposite sides of a classification boundary, but the boundary does not represent an overnight change in health. Avoid treating a rounded display as an exact diagnosis. Use the unrounded calculation for classification, and consider measurement variation, your longer-term pattern and other health information. These categories describe adults; children and teens need an age- and sex-specific assessment.
Keep reading: